Tired of buried insights in complex reports? Turn overwhelming analytics data into clear insights with data visualization. Alan K’necht on January 23, 2024 Today’s digital marketing seems to require an overload of data. With analytics platforms generating vast amounts of information across multiple channels, making sense of it can be challenging. This is where data … Continue reading Data visualization: How to transform analytics data into actionable insights
Tag Archives: Visualization
New solution promises improved data visualization to streamline campaign reporting
New capabilities from Basis Technologies will help agencies communicate campaign performance to clients. Kim Davis on June 9, 2022 Basis Technologies (formerly Centro), the workflow automation and business intelligence provider, has launched Data Canvas, a solution aimed at helping agencies communicate with clients on campaign performance through live dashboards. Data Canvas is seen as an … Continue reading New solution promises improved data visualization to streamline campaign reporting
Top Data Visualization Tools and How to Pick the Right One for Your Team
Nicole Raymond December 28, 2021 In today’s technology-driven world, data is more important than ever. Most companies are collecting at least some kind of data, but not all companies are using their data to its fullest potential. Data-driven decisions can help companies make smarter choices for their business and for their prospects and customers, which … Continue reading Top Data Visualization Tools and How to Pick the Right One for Your Team
Why Kanban is more than a visualization board
It’s about developing a problem-solving mind-set, for example when it comes to clogged workflows. Stacey Ackerman on August 2, 2021 There’s a sentence that I hear over and over again that kind of irks me, and maybe you’ve heard it too? “We’re doing Kanban, we have a Kanban board.” While having a Kanban board is … Continue reading Why Kanban is more than a visualization board
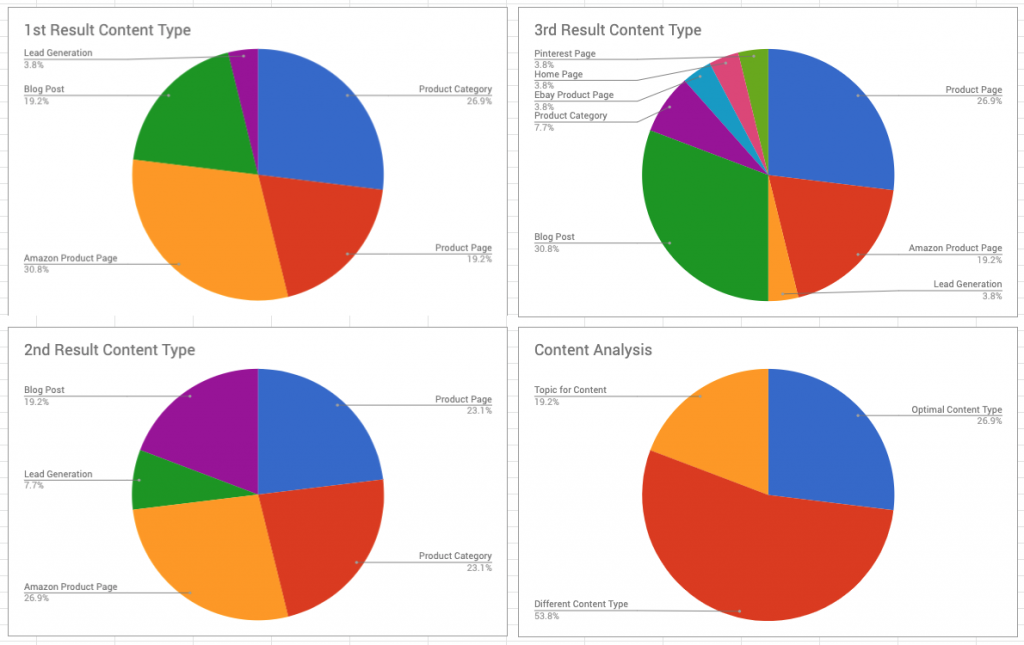
14 Data Visualization Charts for SEO
Ryan Stewart — December 19, 2019 Follow @ryanwashere As marketers, it’s a never ending challenge to get stakeholders to take action on our recommendations. But…I get it. It’s difficult to digest spreadsheets with thousands of rows of data. In all fairness, this is terrible communication tool. Enter data visualizations. Visuals help to quickly communicate our … Continue reading 14 Data Visualization Charts for SEO
How to Use Data Visualization to Make Your Report Design Memorable
Katy French — March 8, 2018 — March 8, 2018 If you’ve gone to the trouble to create a report, you want someone to read it. Whether you’re delivering insights or trying to get support for a new initiative, that information needs to make an impact. To do that most effectively, you need to deliver … Continue reading How to Use Data Visualization to Make Your Report Design Memorable
5 Ways Data Visualization Can Drive Better Sales
Melissa Burns — February 21, 2018 Follow @Melissa_Burns — February 21, 2018 Although text and figures may be the best way to transfer complex information without losses, the sad truth is that human brain has to apply quite a bit of effort to properly process it. In addition to that, your average modern Internet-faring human … Continue reading 5 Ways Data Visualization Can Drive Better Sales

25 Tips to Instantly Improve Your Data Visualization Design
Katy French — June 17, 2017 — June 17, 2017 Data visualization isn’t about displaying data; it’s about displaying data in a way that is easier to comprehend—that’s where the real value lies. If you want to actually “see” what we mean, take a look at this quick video: Unfortunately, a lot of people think … Continue reading 25 Tips to Instantly Improve Your Data Visualization Design

How to Use Visualization to Boost Office Productivity [Infographic]
Nishadha Silva — May 8, 2017 Follow @rumblinglankan— May 8, 2017 Workplace productivity is a big issue for many organizations. In the United States alone, it is estimated that it costs companies around $ 650 billion per year. The biggest factor is the addiction to social media, but there are many other factors at play … Continue reading How to Use Visualization to Boost Office Productivity [Infographic]

A brief introduction to data visualization theory for marketers
We marketers work with a lot of data, but how can we present these data in an easily understandable way? Check out this primer on data visualization by columnist Paul Shapiro. Paul Shapiro on July 13, 2016 I’ve been thinking a lot about data visualization lately and how it applies to our roles as marketers. As … Continue reading A brief introduction to data visualization theory for marketers
Random Posts on

Advantages and Disadvantages of Doing Market Research Before Starting a Business
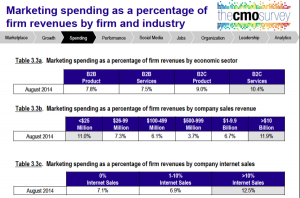
5 Key Tips and Data Points to Defend Your 2015 Marketing Budget
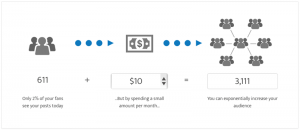
The Real Effect of Running a Facebook Ad Campaign in 5 Charts

Why impression-based advertising will redefine search and CTV
How Brands Are Gearing Up For Halloween
Network Marketing Training Secrets

3 New Strategic Rules of Customer Service
Here’s how brand marketers can use immersive technology to build an effective retail experience
SignalFx Raises $20M, Launches Monitoring Tool for Web-Based Apps