Invesp has put together the numbers behind Facebook advertising and the results are a clear indication that this is where the future of social media advertising lies. The number of Facebook’s user keeps growing. Currently, the estimated number of monthly Facebook users stands at 1.39 billion of which 1.19 billion are Facebook mobile users.
What does this tell us?
Businesses and organizations should focus their digital marketing strategies on mobile advertising because mobile users form the bulk of active social media users. Indeed, advertisers who are using mobile targeting, News Feed ads and custom audiences are already getting good results in terms of number of conversions and click-through rates. If the average Facebook user spends 40 minutes per day on Facebook, then it means that Facebook presents a fertile ground for marketers to sow their seeds of advertising and marketing brands.
As Facebook shared in itsQ4 2014 report, Facebook ad revenue has increased exponentially from $ 1.974 billion in 2010 to 12.4666 billion in 2014 and the figures can only get better. US and Canada claim the biggest part of the pie of the advertising revenue at 45.98%. Europe takes 27.24%, Asia 15.14 while the rest of the world claims 11.61. As a matter of fact, Facebook accounts for 9% of the digital ad spending and 18% of the global mobile digital ad spending.

Infographic source – http://www.invesp.com/blog/facebook-advertising-statistics/
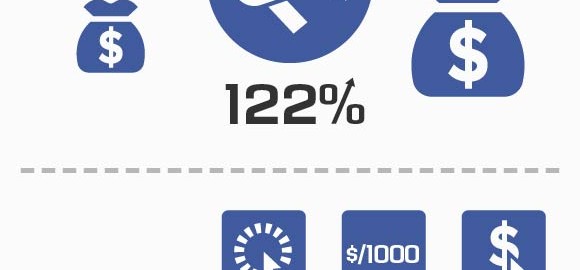
The surge in the effectiveness of Facebook advertising has driven more than 30 million businesses to create a Facebook fan page in the hope of leveraging on the large number of people on social media. 19 million businesses have optimized their pages for mobile viewing while 1.5 million have spent money on mobile advertising. No wonder 92% of social marketers consider Facebook to be a critical tool when it comes to social media marketing. Marketers are now paying 122% more per ad unit than they did last year, thanks to the competition.
While the bulk of Facebook advertising is targeted at users aged between 13 and 65 years old, around 85% of Facebook ads are targeted by country while only 45% are targeted by interest. More advertisers are getting savvier about the importance of creating post engagement, 23% and targeting web, 20% of total ad spend. Other areas include page likes, 13%, web conversion, 13%, mobile app install, 10%, video view, 5%, and the rest takes 16%.
“Shop Now” button leads Facebook CTA in popularity at 74% followed by “Learn More” and “Book Now” at 10% and 8% respectively. Others are “Download” and “Signup” at 4% each.
The Q4, 2014 results also show that the average advertising revenue per user is $ 2.2. US and Canada leads at $ 8.26, followed by Europe at $ 3.22 and Asia stands at $ 1.21
(237)