A few months ago we put together an attribution flow chart to help marketers figure out which attribution model was the right fit for their situation. Based on questions like, “How many marketing channels do you use?” or “How long is your marketing cycle?,” the chart recommended appropriate models.
In this post, we’ll dive deeper into all 11 attribution models and explain the pros and cons of each.
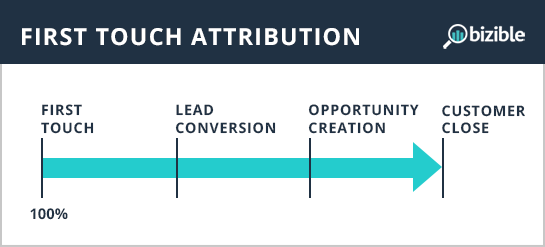
1. First Touch Attribution

The First Touch model gives 100% of the credit to the marketing effort that drove a visitor to your website for the first time.
Because it gives all the credit on the basis of a single touchpoint, it will naturally overemphasize a single part of the funnel. In this case, the First Touch model overemphasizes the top-of-the-funnel marketing channels that drive awareness.
The First Touch model is also more susceptible than other single-touch attribution models to errors from technological limitations. The issue here is that if you are using conversion tracking (e.g. Google Analytics) in a B2B setting, the time between first touch and the conversion can be longer than the common 30 to 90-day expiration on the tracking cookie. So often times, this model is really attributing credit to the first touch that’s within the cookie expiration window, and not the true first touch.
Overall, the First Touch model is a single-touch model that is easy to implement, but is susceptible to channel bias and technology limitations.
2. Lead Conversion Touch Attribution

The Lead Conversion touch model can often be confused with the ‘First Touch’ model. That’s because in a marketing analytics system built around lead generation, like a marketing automation platform, the website session where the lead was created is the first session where data is tracked and measured. In systems like this, if the true first touch was anonymous (read: the visitor didn’t fill out a lead form), it’s like it didn’t exist.
The benefit of the Lead Conversion Touch model is that it helps you understand what marketing channels drive lead conversions. This is important, but it’s also just a small part of the total customer journey. In a long B2B customer journey, there is a lot more to marketing than just the lead conversion and giving 100% of the total credit to just the lead conversion oversimplifies marketing’s role in the customer journey.
3. Last Touch (Opportunity Creation Touch) Attribution

The primary appeal of the Last Touch model is that it is the simplest model for attribution systems to measure.
By measuring and crediting the entire creation of a sales opportunity (the end of most B2B marketing funnels) based on the last touch, the analytics technology has the smallest time window for an error to occur. In long B2B buyer journeys, the time period from last touch to conversion is much shorter, than say, the first touch or the lead touch. This matters because many tracking cookies have a 30 or 90-day expiration. If the conversion doesn’t happen within that window, the marketing channel data will be lost. By attributing 100% of the credit to the last touch, this expiration window becomes superfluous because no time lapses between the last touch and the conversion.
4. Last Non-Direct Touch Attribution

This is slightly more useful than the Last-Touch model, only because it eliminates the limitations of ‘Direct’ data.
When it comes to web and marketing analytics, ‘Direct’ data is a huge pain. Traffic attributed to Direct is typically defined by marketing analytics as any time a visitor manually enters your URL. But in reality, just about every marketing analytics product considers any visitor who doesn’t have a referral source as Direct. A common behavior that gets classified as Direct is traffic from untagged (or improperly tagged) social posts, social ads, or untagged emails. Rather than having its own filter, Direct becomes the catch-all bucket for traffic that doesn’t qualify for any of the other filters.
In short, Direct data is often misleading. The major upside of the Last Non-Direct Touch, then, is that you avoid the troubles of Direct channel data.
5. Last [Insert Marketing Channel] Touch Attribution

This is the catch-all bucket for channel-specific attribution models. Search marketers will want to use the Last AdWords Touch model. Social marketers who want to show their value will use Facebook’s default Last Facebook Touch model or Twitter’s default Last Twitter Touch model.
Note that by ‘last touch’ it means the last touch before whatever conversion you configured the analytics to measure. This could be the lead conversion, the opportunity conversion or whatever you set it up to be.
The upside is that these models usually come standard with their channel — Facebook Insights uses a Last Facebook Touch model, AdWords Analytics uses a Last AdWords Touch Model and so on.
The negative is that each of these models is extremely biased to their own channel and overvalue their respective impact. If you use each of these attribution models separately, and then aggregate them into a single report, you’ll likely double-count or triple-count conversions. For example, if a visitor clicks on a Facebook ad on Monday and then an AdWords ad on Tuesday and then converts, both Facebook’s Last Facebook Touch model and AdWords’ Last AdWords Touch model will claim 100% of the conversion credit.
6. Linear Attribution

Linear is the simplest of the multi-touch attribution models. It distributes credit by evenly applying credit to every single touch in the buyer journey.
The positive is that it is a multi-touch model, so it gives credit to marketing channels throughout the multiple stages of the funnel.
The negative is that it doesn’t take into account the potential for varying impact of marketing touches. For example, if a prospect spends two days at one of your user conferences and then goes home and visits your site 19 times via Direct and then converts, your user conference will get 5% of the credit, even though it likely did most of the heavy lifting. Direct, on the other hand, will get 95% of the credit.
7. Time Decay Attribution

The Time Decay model is a multi-touch model that gives more credit to the touchpoints closest to the conversion. It makes the assumption that the closer to the conversion, the more influence it had on the conversion.
The problem with this assumption is that it will never give a fair amount of credit to top-of-the-funnel marketing efforts because that will always be the farthest away from the conversion.
8. U-Shaped (Position-Based) Attribution

The U-Shaped model, which Google calls Position-Based, is a great multi-touch attribution model for marketing teams that focus on lead generation. It’s a multi-touch model that tracks every single touchpoint, but rather than give equal credit to all touchpoints like the Linear model, it emphasizes the importance of two key touchpoints: the anonymous first touch that got the visitor in the door and the lead conversion touch. These two touches get 40% credit each and the remaining touchpoints equally split the remaining 20%.
The downside to this model is that it doesn’t consider marketing efforts beyond lead conversion. This makes it an ideal model for lead reports or for marketing organizations that don’t do marketing targeted to prospects beyond the lead stage.
9. W-Shaped Attribution

The W-Shaped model takes the concepts of the U-Shaped model to the opportunity stage, which for many organizations is the end of the marketing funnel. In addition to giving extra emphasis to the anonymous first touch and the lead conversion touch, the W-Shaped model also gives emphasis to the opportunity creation touch. These three key touchpoints receive 30% credit each, and the last 10% is split equally among the remaining touchpoints.
In spreading the credit with this distribution, the W-Shaped model highlights the three key funnel transitions that marketing impacts in the customer journey.
10. Full-Path (Z-Shaped) Attribution

Taking it even one step further, the Full-Path model (or Z-Shaped model) also accounts for marketing beyond the opportunity stage. Rather than two key stages represented in the U-Shaped model or the three key stages in the W-Shaped model, the Full-Path model adds a fourth key stage: the customer close.
In this model, each of the touchpoints at the four key stages receives 22.5% of the credit and the last 10% is split equally among the remaining touchpoints.
While it may seem like more key touchpoints is a better and more accurate representation of the customer journey, this model is really only appropriate for marketing organizations that do marketing to existing sales opportunities. Most organizations, unless there is extreme alignment between the sales and marketing teams, tend to let their AEs control the conversation and messaging when they are trying to close deals. Before you try to adopt this attribution model, be sure to sync with your sales team.
11. Custom or Algorithmic Attribution
The last attribution model is to have a data scientist build a custom or algorithmic attribution model that best matches the customer journey specific to your buying process. By analyzing your existing customer data, you can see which marketing channels have an outsized impact or if there is a particular step in the customer journey that is important.
This is clearly the most difficult and time-consuming model to build, maintain, and use, but it will also give you the most accurate representation of your marketing’s impact on the customer journey.
Ready to learn more about attribution? Check out the introductory guide to attribution below:
Business & Finance Articles on Business 2 Community
(108)