— July 24, 2019
How do CRO professionals run experiments in 2019? We analyzed 28,304 experiments, picked randomly from our Convert.com customers.
This post shares some of our top observations and a few takeaways about:
- When CROs choose to stop tests;
- Which types of experiments are most popular;
- How often personalization is part of the experimentation process;
- How many goals CROs set for an experiment;
- How costly “learning” from failed experiments can get.
Let’s begin.
1. One in five CRO experiments is significant, and agencies still get better results.

Only 20% of CRO experiments reach the 95% statistical significance mark. While there might not be anything magical about reaching 95% statistical significance, it’s still an important convention.
You could compare this finding with the one from Econsultancy’s 2018 optimization report in which more than two-thirds of respondents said that they saw a “clear and statistically significant winner” for 30% of their experiments. (Agency respondents, on the other hand, did better, finding clear winners in about 39% of their tests.)
Failing to reach statistical significance may result from two things—hypotheses that don’t pan out or, more troubling, stopping tests early. Almost half (47.2%) of respondents in the CXL 2018 State of Conversion Optimization report confessed to lacking a standard stopping point for A/B tests.
For those experiments that did achieve statistical significance, only 1 in 7.5 showed a lift of more than 10% in the conversion rate.
In-house teams did slightly worse than average: 1 out of every 7.63 experiments (13.1%) achieved a statistically significant conversion rate lift of at least 10%. Back in 2014, when we published an earlier version of our research on CXL, this figure was slightly higher, about 14%.
Agencies did slightly better: 15.84% of their experiments were significant with a lift of at least 10%. This number was much higher (33%) in our earlier research, although the sample size was significantly smaller (just 700 tests). Still, in both studies, agencies did better than in-house CRO teams. This year, they outperformed in-house teams by 21%.
(We didn’t find any significant difference between agencies and in-house customers when comparing their monthly testing volumes.)
2. A/B tests continue to be the most popular experiment.
A/B testing (using DOM manipulation and split URL) is still the go-to test for most optimizers, with A/B tests totaling 97.5% of all experiments on our platform. The average number of variations per A/B test was 2.45.
This trend isn’t new. A/B tests have always dominated. CXL’s test-type analysis over the years also shows this. Back in 2017, CXL’s report found that 90% of tests were A/B tests. In 2018, this figure increased by another 8%, reinforcing A/B testing as the near-universal experiment type.
Certainly, A/B tests are simpler to run; they also deliver results more quickly and work with smaller traffic volumes. Here’s a complete breakdown by test type:
- A/B DOM: 80.9%;
- A/B Split URL: 16.6%;
- A/A: 1.15%;
- Multivariate (MVT): 0.78%;
- Personalization: 0.57%.

North American optimizers ran 13.6 A/B experiments a month, while those from Western Europe averaged only 7.7. Using benchmarks from the 2018 CXL report, that puts our customers in the top 30% for testing volume.
There were other cross-Atlantic differences: Western Europe runs more A/B tests with DOM manipulation; the United States and Canada run twice as many split-URL experiences.
3. Optimizers are setting multiple goals.
On average, optimizers set at least four goals (e.g. clicking a certain link, visiting a certain page, a form submit, etc.) for each experiment. This means they set up three secondary goals in addition to the primary conversion rate goal.

Additional “diagnostic” or secondary goals can increase learning from experiments, whether they’re winning or losing efforts. While the primary goal unmistakably declares the “wins,” the secondary metrics shine a light on how an experiment affected the target audience’s behavior. (Optimizely contends that successful experiments often track as many as eight goals to tell the full experiment story.)
We see this as a positive—customers are trying to gain deeper insights into how their changes impact user behavior across their websites.
The 2018 edition of Econsultancy’s optimization report, too, saw many CRO professionals setting multiple goals. In fact, about 90% of in-house respondents and 85% of agency respondents described secondary metrics as either “very important” or “important.” While sales and revenue were primary success metrics, common secondary metrics included things like bounce rate or “Contact Us” form completion rates.
The Econsultancy study also found that high performers (companies that secured an improvement of 6% or more in their primary success metric) were more likely to measure secondary metrics.
4. Personalization is used in less than 1% of experiments.
Personalization isn’t popular yet, despite its potential. Less than 1% of our research sample used personalization as a method for optimization, even though personalization is available at no added cost on all our plans.

Products like Intellimize, which recently closed $ 8 million in Series A funding, and Dynamic Yield, recently acquired by McDonald’s, are strong indicators of investors’ and corporate America’s big bet on personalization.
But as far as the CRO stack goes, personalization is still a tiny minority. A quick look at data from BuiltWith—across 362,367 websites using A/B testing and personalization tools—reinforces our findings:
- Google Optimize 37%;
- Optimizely 33%;
- VWO 14%;
- Adobe 6%;
- AB Tasty 4%;
- Maxymiser 3%;
- Dynamic Yield <1%;
- Zarget <0.5%;
- Convert <0.5%;
- Monetate <0.5%;
- Kameleoon <0.5%;
- Intellimize <0.1%.
We did find that U.S.-based users are using personalization six times more often than those from Western Europe. (Additionally, some 70% of those on our waitlist for an account-based marketing tool are from the United States, despite the product being GDPR-compliant.)
Personalization in the European market and elsewhere may rise as more intelligent A.I. optimization improves auto-segmentation in privacy-friendly ways.
Back in 2017, when Econsultancy surveyed CRO professionals, it found personalization to be the CRO method “least used but most planned.” Some 81% of respondents found implementing website personalization to be “very” or “quite” difficult. As several reports mentioned, the biggest difficulty for implementation of personalization was data sourcing.
Our findings on personalization diverged with a few other reports from the CRO space. Econsultancy’s survey of CRO executives (in-house and agency) reported that about 42% of in-house respondents used website personalization, as did 66% of agency respondents. Dynamic Yield’s 2019 Maturity Report reported that 44% of companies were using “basic” on-site personalization with “limited segmentation.”
When CXL surveyed CRO professionals for its 2017 report, 55% of respondents reported that they used some form of website personalization. In the latest CXL report, respondents scored personalization a 3.4 on a 1–5 scale regarding its “usefulness” as a CRO method.
In Evergage’s personalization trend report, homepages and landing pages were the top areas for personalized experiences (45% and 37%, respectively), followed by product pages (27%).
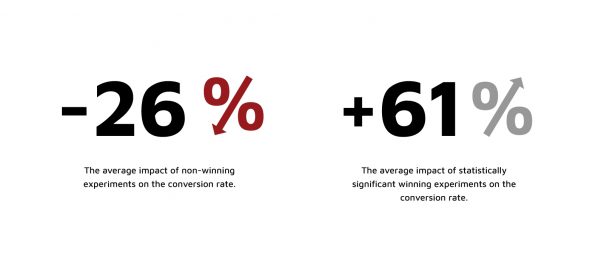
5. Learnings from experiments without lifts aren’t free.
In our sample, “winning” experiments—defined as all statistically significant experiments that increased the conversion rate—produced an average conversion rate lift of 61%.
Experiments with no wins—just learnings—can negatively impact the conversion rate. Those experiments, on average, caused a 26% decrease in the conversion rate.
We all love to say that there’s no losing, only “learning,” but it’s important to acknowledge that even learnings from non-winning experiments come at a cost.

With roughly 2.45 variations per experiment, every experiment has around an 85% chance of decreasing the conversion rate during the testing period (by around 10% of the existing conversion rate).
Businesses need to archive and learn from all their experiments. According to the CXL report, about 80% of companies archive their results, and 36.6% use specific archiving tools. These are strong indicators that CROs are refueling their experimentation programs with learnings from past efforts.
But while tracking results and documenting learnings can improve a testing program in the long run, there’s urgency to learn from failed experiments and implement successes quickly.
There’s also a need to research and plan test ideas well so that experiments have a higher likelihood of success. The ResearchXL model is a great way to come up with data-backed test ideas that are more likely to win.
Conclusion
While our research helped us establish some industry benchmarks, a few of our findings hardly surprised us (for example, the popularity of A/B tests).
But what did surprise us was that so few customers use personalization. We expected more businesses to be progressive on that front since the feature is available in all our plans and doesn’t require massive traffic volumes. As noted earlier, better data management may make personalization easier for companies to execute.
Other than that, we view the setup of multiple goals as a positive sign—testers want to dig deeper into how their experiments perform to maximize learnings and, of course, wins.
Business & Finance Articles on Business 2 Community
(56)