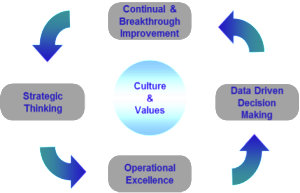
At Sigmapro we have studied many organisations that have achieved success, and identified four organisational competences that are required to achieve a sustainable approach to business improvement. These are Strategic Thinking, Operational Excellence, Data Driven Decision Making and Continual & Breakthrough Improvement. Supported by the right kind of culture, values and leadership, an organisation can achieve sustainable improvement.

So what do we mean by Data Driven Decision Making and why is it important?
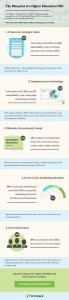
Data Driven Decision Making can be considered in 4 aspects:
- Availability
- Accuracy
- Analysis
- Use
Data should be available when and where required, it must be accurate, able to be analysed easily and subsequently used in decision making.
Before we get into detailed discussion on each of the above 4 areas, let’s consider why data driven decision making is required. Genichi Taguchi stated that “If you cannot measure, you cannot improve”. Without data we have no way of knowing whether we are improving or getting worse. It has also been said that “what gets measured gets improved”.
In his article “Intuition vs. Data-Driven Decision-Making”, Bob Sutton quoted that “gut feelings” are highly suspect for two reasons, the first of which, Confirmation bias, means that people find it difficult to remember and use evidence that contradicts their beliefs, so without data to make objective decisions they will tend to go with what they already know or believe to be true. The second, the Fallacy of centrality, quotes that people believe that if something important happens, they will know about it. Without effective data systems, people will not get to know important things happening, for example a major customer starts not receiving product on time. Data is required to enable people to understand what is happening in the organisation.
Some will argue that making decisions it is not always possible to base decisions on data, and of course this is true. It must be recognised however that making decisions without data is about risk. Data driven decision making is about reducing risk to the organisation. If we are making decisions using data then of course the data must be accurate. Making decisions with inaccurate data can be worse than not having the data at all!
Data Availability
One of the fundamentals of managing organisations is to understand how the organisation is performing in relation to the strategic goals that have been set. This requires a framework of performance measures to be developed that is consistent with those strategic goals, for example if business growth is important then measure sales value, or number of new customers, if customer satisfaction is important then measure feedback from customers, or the level of complaints.

The framework of performance measurement needs to then be cascaded down into the organisation, so that decisions can be made at all levels. The key to developing an effective framework is to ensure that the measurement framework is aligned from top to bottom, and that key business targets are cascaded down into success factors, then functional objectives and finally individual targets. Taking a simple example, consider a business with three functions, sales, planning and production. If the business wants to grow, it may identify that customer satisfaction is a critical success factor. Looking at what sales need to do to ensure customers are satisfied, they would need to understand customer needs and translate this into a specification. Planning then need to plan to achieve the agreed specification, production then need to produce and ship to plan. The measures developed at functional level would then be numbers of orders with complete specification, errors on the production plan, and shipments against plan. Individual measures and targets also need to align.
If performance of our chosen organisation is not as planned, then within improvement work data availability is also important. Decisions need to be made for example in relation to which customers or which type of orders should be focused on to improve performance. Data may not be already available, and will have to be collected specifically for the project. Lean Six Sigma promotes a specific approach to the identification, prioritisation and collection of project data.
Data Accuracy
Most people assume that the data they collect is accurate, or don’t even consider accuracy limitations at all. But consider whether data collected about customer complaints accurately reflect the level of customer satisfaction. Data collected on customer satisfaction showed that in the average business, for every customer who bothers to complain, there are 26 others who remain silent, and just walk away, so how accurate is our data if we base it on customer complaints?
Consider the following example: drop a piece of paper 3 times and ask 3 different people to time how long it takes to fall to the floor. Assume the following data is collected (this is based on actually doing this by the way and is not made up data!)

Clearly any differences between the three timers can only be due to differences in the measurement systems, caused either by the equipment or the measurers!
But now lets consider that we are trying to improve the process of paper dropping and the faster the time the better the process is performing. If we take Timer A, then from Drop 1 to Drop 3 we are seeing an improvement, so we are happy. If we take Timer C then we are seeing a worsening of performance so we are not happy! The measurement variation is the only difference. We can see from this simple example how important accurate data is.

Consider another example, that of making a decision on a component to decide whether or not it is acceptable to send to a customer. We take a measurement of the component and it shows it to be inside the lower specification limit (LSL) as indicated by the blue line on the diagram above. Do we accept or reject the component? Now let’s assume we know that there is variation in the measurement system, again as shown above. Do we now accept or reject? What about if we know there is variation but we don’t know how much variation?
In one project, there was an inspection prior to despatch which considered defects on a smooth surface. It was shown that the inspection process was totally inadequate, with so much error that the decision to accept or reject might as well have been taken by flipping a coin rather than actually looking at the components!
Clearly, understanding of variation or error in data and measurement systems is a very important topic.
Data Analysis
The third area to consider is data analysis. Turning data into meaningful information that can be actually used. Consider again our customer satisfaction example above. Let’s assume that we collect data about levels of satisfaction, making sure of course that the data is accurate. We turn the data into an index, with scores between 0 and 10. We have surveyed over 1,000 customers and have a list of the results for each customer. A sample of 100 data points is shown below:

What does the data tell us?
To make sense of it we need summarise it is a way that allows us to see some aggregated data. We can plot the data using a statistical package, such as Minitab, as shown below. This now tells us pictorially that the customer satisfaction scores vary between 6 and 10. The average (mean) value is 8.050 and the standard deviation is 1.124.

The basic statistical parameters for a dataset are as follows:
Mean (average). The formula for this is:

Median (the middle value, or the point at which 50% of the data lies either side of)
Mode (the most frequently occurring value, in the data above this would be 8.25)
Range (maximum value – minimum value)
Standard Deviation. The formula for this is:

We could further analyse this data to show which type of customers had the poorest scores, and then of course work on trying to improve these scores.
The other point of course is that we have only got data for 100 customers, not the 1,000 that we have in total. What we are in effect doing is to form opinions about all customers from a sample of them. This is called inferential statistics.

Inferential statistics allows us to estimate the parameters of the whole population based on a sample of data. We can then make decisions on the whole population with a certain degree of confidence, without the cost and time required to collect all the data from all customers. Of course in many situations it is not possible to collect all the data, for example if we are interested in knowing the average height of people in the country. Our only option is to survey a proportion of the people and use the data collected to make decisions about the whole population.
Data Usage
The last component is usage.
For the other three aspects of data driven decision making to add value, the data must be used to actually drive decision making! In some ways this is partly down to culture change. If people within an organisation are used to making decisions without data, then the culture is often one of “he who shouts loudest”, in other words the most senior people make the decisions based on how and what they feel about the topic in question. Decision making becomes more about opinions rather than data.
Once data is provided and people start to use it, then over time the culture changes from one of “he who shouts loudest” to “what does the data tell us”. In working with many different organisations over many years, this change in culture can truly be seen, as more and more people start to ask “and what data do we have on this”.
In summary, to achieve data driven decision making requires four elements, availability must be planned and organised, the data must be proven to be accuracy, data must be effectively analysed and the data must be used in decision making. The last component is as much about culture as it is about the actual data itself.
Business & Finance Articles on Business 2 Community
(434)