Columnist Matt Umbro shares tips on creating account update reports with just the right amount of — and the most impactful — detail.

Creating meaningful reports that readily showcase the performance of paid search initiatives is easier said than done. I’ve found that the majority of reports fall into three buckets.
- Too much data leading to information paralysis
- Poor formatting or inappropriately presented data
- Irrelevant data that the person reviewing the report doesn’t need to see
We can argue what constitutes too much, inappropriately presented, or irrelevant data, but I believe we can agree that we’ve seen our share of ineffective reports.
In this post, I will outline my tips for populating and presenting reports that matter — tips that you can apply to any performance-oriented initiative in addition to paid search.
Give Your Metrics Context
Setting aside the actual metrics, reports that show data without any time or account activity context lead to questions. I like to show both month-over-month and year-over-year trends where possible.
You might present data showing ROI at 500% for February, but immediate follow-up questions may be:
- What was ROI in February 2014?
- Did we spend more or less this year to achieve this ROI?
- Did conversion volume suffer to hit this ROI?
Ultimately, clients come to PPC vendors — and companies expect their in-house marketers — to grow their paid search programs. Charting account activity over time gives report readers the context necessary to answer these growth questions.
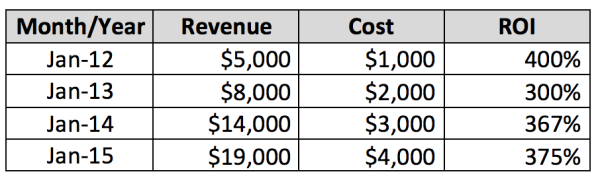
Here’s an example of how we may present a fictional e-commerce client’s data and the answers we can glean. Let’s take a look at these two charts.


If our client prefers to look at the data in a table, we can present this view instead.

Performance metrics
Based on the data, we can provide these bullet points of information.
- Both revenue and cost have quadrupled from 2012 to 2015
- ROI has improved every January since 2013 even though costs have increased each year
- The account is spending more each year while also showing a better return
Now that we’ve successfully presented the data in the context of time, we need to explain the account work that led to these numbers.
When providing this analysis, it’s easy to share too much information. I generally include a couple bullet points describing the month’s activity, which we can then expand upon during our meeting.
Here’s an example table I would use to cover the key points.

Initiatives by year
Instead of presenting tables of activity by campaign, keyword, etc., we’ve charted each key metric’s performance over time and provided insight.
Anyone who sees this report can easily glean performance of the paid search program and understand the key points leading to the account status.
The scenario above is only one example. We could apply the same principles to a lead gen campaign looking at overall leads and opportunities. Or, we may want to review how effective our social campaigns are in driving brand awareness.
No matter the case, find the metrics that the client deems important and provide the necessary context using time and account activity.
Break Out Brand Vs. Non-Brand
Related to PPC account growth is the distribution between brand and non-brand traffic.
It’s great when overall metrics improve over time, but it’s even better when non-brand is a bigger slice of the pie. Non-branded traffic represents new customers and leads. If growth can be shown here, it is an encouraging sign for the overall health of the account.
I’ll show this growth both through a graph and table.


Revenue breakdown
Non-branded growth is excellent to report, but by no means am I discounting branded growth. Aside from the fact that more branded traffic indicates greater customer awareness, it may also show that non-branded PPC campaigns are assisting in the conversion process.
Indicate Poor Performing Areas
Just as important as highlighting the positive is shedding light on negative areas of the account.
I like to include tables that reference poor performing campaigns, keywords, ad copy and landing pages. I may sort these items by any number of metrics, including:
- Lowest conversion rates with at least “x” number of clicks
- High cost per conversions with at least “x” number of clicks
- Greatest number of clicks without any conversions
- Highest landing page bounce rate with no more than “x” number of conversions
Even though you are highlighting poor performers, the account impact can be positive. Focusing on these tables will help you and your client speak about improvements. Beyond new messaging ideas, looking at poor performing ads can inspire a review of pricing in the marketplace.
For example, I once worked with a client whose keywords and ads for a particular product saw great click-thru-rates (CTRs) but weren’t converting.
The queries were relevant, and the landing page delivered on the ads’ promises. The problem was that this merchant had higher prices than the competition. Instead of just pausing this campaign, the client reached out to the manufacturer for better pricing and promotions. Lo and behold, the merchant was able to drop prices and conversions picked up.
Showing poor performing results can also help spur new account features, further keyword research, and landing page testing. Looking at negative results can lead to positive account growth in the long term.
Final Thoughts
It’s not difficult to adjust your reports to include pertinent data and allow for more conversation.
In fact, the majority of the data you present today can most likely be reframed in a more meaningful light. Ask yourself if the data shows anything definitive or if it’s just noise. If the latter, find out what data and in what view it will be impactful.
Make it your goal to ensure that all facets of your reports contain worthwhile information that can be easily processed and acted upon.
Some opinions expressed in this article may be those of a guest author and not necessarily Marketing Land. Staff authors are listed here.
About The Author

Matt Umbro is a Senior Account Manager in charge of Community at Hanapin Marketing. He specializes in eCommerce PPC and client relations, and he also oversees content production for PPC Hero.
(Some images used under license from Shutterstock.com.)
Marketing Land – Internet Marketing News, Strategies & Tips
(346)