
If you’re truly invested in improving your PPC campaigns, then part of your ad budget is dedicated to running tests. Things like:
- Trying out new traffic sources
- Identifying hot keywords
- Finding the right ad copy
It’ll take a lot of work. Digging through keyword planners, writing and rewriting the same 35 characters over and over again, and staring at spreadsheets until you think you’ll go blind?
Doesn’t that sound like fun?
Not only are you taking time and effort to run the test, but your company or client has to foot the bill. Each PPC test is live, “out in the wild.” So people are clicking on the ads and when they do, it costs you.
Don’t you want to make sure all that time and money is worth it? I get super frustrated when I run a test that feels like a waste in the end. It’s the worst feeling, second only to regretting the test as a whole. That happens when one ad gets more conversions than the other, I give it a crown and declare it king, and then it stops working for me.
As Stephanie Tanner on Full House would say, “How rude.”
Luckily, there’s a handy way to run a sort of quality assurance check on your A/B tests. Before you declare a winner on your next test, ask yourself, “Are these results statistically significant?”
What’s Statistical Significance?
To put it simply, statistical significance is the probability that your results can be repeated. How likely it is that your results aren’t due to chance. An assurance that they weren’t due to some outside factor you can’t control.
Everyone likes to think they’re in control. But let’s be real. A tiny fluke can have a huge impact on the universe. So for one to completely throw off your PPC test? It really doesn’t seem that unlikely. Sorry.
Now it’s time to get into more detail and remember that statistics class you took in college. Statistical significance establishes whether there’s really a cause and effect relationship between the test and its results. It’s kind of like the opposite of margin of error. A margin of correctness, if you will. 🙂
(At least, the way I see it. A statistics professor might say otherwise on that one.)
Remember sitting in a lecture hall and hearing things about confidence levels? That’s what statistical significance is based on. If a test has a high confidence level, the results can likely be repeated. For something to be statistically significant, you need your confidence level to be at least 95% (though some still consider that too low).
Why Statistical Significance Matters
The whole point of A/B testing is to improve your campaigns in the long-run, right? Without statistical significance, there’s little chance of that happening.
If you’re using insignificant test results to guide your PPC strategy, there’s no guarantee that your campaigns will improve. Because there’s a lower probability that the results could be repeated, you won’t know what to expect. And you won’t know for sure that the ad you declared a “winner” is actually better than the loser.
In Real Life
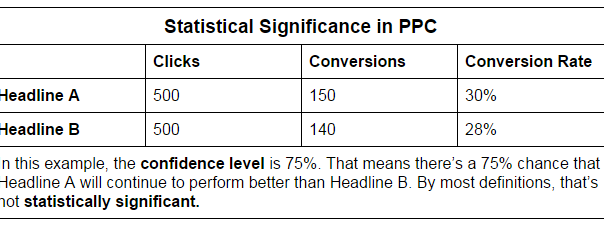
For example, say you ran an A/B test to see which of two headlines lead to more conversions. You set up the test, let the two ads run for a week, and check in on the results. Headline A had a 30% conversion rate (Not too shabby! Congrats!), and Headline B converted 28% of the time.
That means Headline A was better, right? Wrong. If you calculate the test’s confidence level (which we’ll talk about later), it’s only at 75%. Not very significant.

I mean, maybe Headline A was better. But not necessarily. We need more details to decide. Let’s look more closely at Headline A. The ad with that one saw 500 clicks, and 150 conversions, giving us that 30%. Headline B’s ad also got 500 clicks, leading to 140 conversions.
Ten more conversions isn’t a very big difference. For a sample size of 500, it’s not that significant (there’s that word again!). How can you know that Headline A was really better than Headline B? And not just that, that it was good enough to stop using Headline B? There’s only a 75% chance it will keep getting you a 30% conversion rate.
What Happens When You Ignore It
So you read this post, aren’t impressed, and go back to that original PPC test looking at headlines. You say, “Brittany is ridiculous,” turn off the ad with Headline B, and pour the rest of your budget into Headline A’s ad. Things are going okay for awhile, but then its conversion rate drops from 30% to 21%.
Oops, what went wrong?
Remember those possible flukes we talked about earlier? One of those was probably wreaking havoc on your campaign. Maybe a competitor changed their own PPC strategy, and it impacted the performance of yours. Or maybe people’s searching behavior was changed by current events, and how it’s returning to normal.
For awhile, it was actually making Headline A’s conversion rate better, so you didn’t consider it a bad thing. Or didn’t consider it at all.
But then that devilish fluke either stopped messing with your campaign, or it started to have the opposite effect that it used to.
How to Calculate Statistical Significance
The good news is that it’s pretty easy to just calculate yourself. I mean, look at all the formulas you have to choose from:

Just kidding! Those give me a headache.
The good news is that there are a ton of online tools that will calculate your test’s confidence interval. Then all you need to do is look at the number it spits out and decide whether or not it’s higher than 95, which I think you can manage. If the answer’s “yes,” your test is significant! Congrats.
Here are some of my favorite online calculators you can use, all specifically designed for marketers to use for their A/B tests:
What to Do with an Insignificant Test
Just because your test’s results aren’t statistically significant right now doesn’t mean you need to throw out the whole thing. The right way to think is that the results aren’t significant yet.
Low confidence levels are usually caused by:
- Your sample size being too small.
- Your testing period being too short.
- Too small of a margin between results.
Luckily, those first two problems are easily remedied. Just let the test run longer. That solves problem #2. Keeping the test ads live will get you more clicks, making your sample size larger. Problem #1, goodbye. Most likely, with time, the test will work itself out and the winner will make itself clear.
But what if it doesn’t?
Well, you may need to declare a tie. But after a few of those declarations of my own, I’ve realized that’s not a bad thing. You can still learn from the results. You may not have learned that one headline is better than another, but you have figured out that they’re about equal. From there, you can create new tests or replace some of your lower performing headlines with the two that both got pretty good conversion rates in your test.
Be Confident!
So go forth and be significant! You’ll love being able to go to your boss and say confidently (badum chhh) that, “There is a 97.36 percent chance that we would be able to repeat this conversion rate, should we permanently use Headline A.”

(298)