In the 2020 landscape, we absorb five times the amount of information we did in 1986. Naturally, infographics are the perfect response. They’re a respite for consumers who receive too much information, but also a way for businesses to get meaningful info out into the world. Here’s how to create and distribute an infographic that people will actually see and consume, instead of letting it get lost in the chaos.
When creating an infographic, don’t forget these 4 steps
1. Perform an industry study.
Why go so far as to run an industry study for an infographic? Because you want to be a thought leader in your industry. With market research analysts abounding, it’s quicker and easier than ever to acquire research that’s unique to your brand. Use your infographic as a chance to bring meaning into the world, and stand as the primary source for data that may be used for years.

Image Source: Ignite Visibility Industry Study
2. Pair it with a blog post.
Infographics are easy on the eyes (one study shows that colored images boost someone’s willingness to read by 80%). At the same time, blog posts are your gateway to ranking on SERPs, making them the SEO queen. Write a blog post divulging all there is to know about your infographic’s data, then implement the infographic right on the page.

Image Source: Ignite Visibility Blog
3. Focus on the embed codes.
Instead of making one big infographic with one big embed code, break it up into smaller chunks. This makes the embed codes more minimal (AKA easier to implement on sites who prioritize page speed). It also makes readers more likely to share your content on their own blog posts or social media profiles. A clear-cut path to backlinks, anyone?
4. Optimize the downloadable report.
You can, and should, offer a downloadable report (and you can include the download button right near the embed button). To optimize it, require input of an email address for access. Voila! Email lead secured.

Easy distribution channels for your infographic
- Press releases: Once you have the data from your industry study and have crafted your infographic in full, consider writing up a press release. You can send it to folks in the industry as well as media professionals within your network.
- Digital PR outreach: Want to boost your backlink production? Reach out to authors or hosts of old articles around the web that tackle a similar topic as that of your infographic. Send them a couple of images from your content (mini infographics, if you will) and have them implement the images into their post. This updates their content and brings value to it, at no cost to them. (Be sure to outline what’s in it for them!)
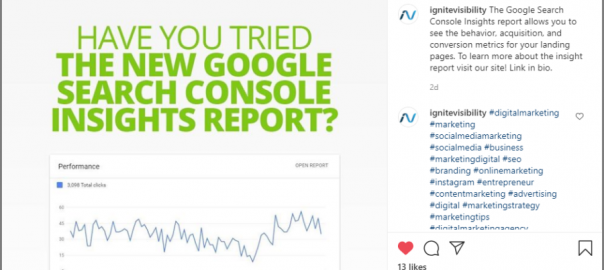
- Social media posts: With an in-depth infographic comes a lot of social media content. You can break up your creation into bite-sized chunks suited for Instagram, Facebook, Twitter and more. Use it for feed posts and stories alike.

Image Source: Ignite Visibility Instagram
- Middle- and top-funnel ads: While data from infographics may not be suited for bottom-of-the-funnel conversions, it is great for garnering brand recognition and keeping your audience intrigued. Make ads for social platforms like Facebook and search engines like Google using the most captivating parts of your findings.
- Landing pages: If an ad gets someone to your landing page, you might as well keep that credibility rolling. Include visual data on your website for maximum authority. Then, retarget even more ads to your site visitors with additional information sourced from your infographic.
- Webinars and events: You can build entire webinars, video events and live events (the latter of which may or may not be a thing of 2021) around your infographic’s data. This is a perfect way for you to soak up all possible value from a single industry study.
- Direct mail: Turn that infographic into tangible, beautiful, readable, viewable direct mail. This includes postcards, self mailers, booklets, letters, circulars, wraps, inserts, parcels and catalogs. (Plus, catalogs are proven to discourage comparison shopping by more than 7%, according to the USPS.)
- Media pitches: Implement infographic segments (or the infographic as a whole) into your media pitches. This sets you up as an expert in your field or industry, making you the perfect contact for a news article source.
- Experiential banners: Transform a portion of your infographic into a real-world banner. Hang it up in a storefront, at an office, on a billboard or anywhere else that makes sense.
For infographics, the proof is in the pudding
One study shows that people remember 80% of what they see and do, as well as 20% of what they read. Combine reading and visualizing for the optimal concoction of information retainment, AKA infographics. That’s why emphasizing the creation and distribution process of infographics is so important. Otherwise, you’re wasting money, time and the potential to reach multitudes.
Digital & Social Articles on Business 2 Community
(44)